
Proofing Your System: How to Determine if Your Strategy is Likely to Work
The sports betting industry is an extraordinarily lucrative one. The Gross Gambling Yield in Britain alone was over £14.4 billion in 2018! Like practically all thriving markets, it is also laden with charlatans. Twitter, in particular, is rife with such things.
There are ‘expert’ tipsters everywhere, though a high proportion tends to go underground when things go wrong. A troubling trend sees certain tipsters aligning themselves with bookmakers.
As you can guess, they make a profit from providing duff tips because they enjoy a revenue sharing exercise with the bookmakers. It is in your best interests to avoid such individuals or companies.
Predictology has no such arrangements with any bookmaker. We earn no incentive or commission from bookmakers anywhere on the site. We are independent and we intend to remain so.
We act in the interest of Bettors, not Bookmakers
Beware Inflated Profits
Some tipsters grossly inflate their profit margins. This is surprisingly easy to do. In previous articles, I wrote on creating systems with different strike rates. I pointed out the difference between ‘average’ and ‘maximum’ odds on the Predictology System Builder. Predictology includes both so you can see the difference for yourself – as punters we should always be aiming for the ‘best price’ but we should also be realistic that this is not always going to be possible.
Therefore, a tipster can quote the best possible odds for any bet. The trouble is, these odds were possibly only available for 34 seconds at 5:43 am!
I’ve also previously mentioned that marketing strategies typically involve getting punters to sign up during a hot streak. This is perfectly acceptable, as long as the company provides a detailed outline of system performance, as Predictology does with all of our strategies. From there, you can analyse the system to see if it is likely to continue in a similarly profitable vein.


How to Analyse a Betting System
But where on Earth do you begin with this analysis? Don’t worry; I am about to show you! Indeed, I have already outlined the calculations you need in previous articles. This week, I’m bringing everything together. Regardless of the system, you need the following information:
- Number of bets
- Number of wins to calculate strike rate
- Profit in units so you can calculate ROI if that information isn’t available
- Longest winning and losing streaks
- Maximum drawdown
You need every single wager, and you need to know how long the tipster has had the system in play, or at least in a testing phase. You’ll notice that Predictology offers all of this on the ‘Extended Analysis’ section of each system. We also enable users to download the full set of results, a process that allows for detailed analysis on your part if you wish.
Don’t Fall Into the ‘Hot Streak Trap’
Personally, I won’t even look at a system unless it provides at least three seasons’ worth of consistently good results. It is all too easy to get lured in by a sexy ROI, only to discover that it is based on one good year, or worse, a short series of long odds wins.
When I was looking for systems that offered a reasonable profit for the previous articles, I came across many mirages. It is easy to get sucked in by a BIG profit, but there’s pain ahead if you don’t analyse the strategy. Imagine labouring under the impression that a bad system will ‘come good.’ Sadly, it happens far too often.
Predictology Members receive a three-part in-depth guide into how to build, prepare, test and measure the success of a betting strategy. It takes the principals of today’s article and goes much further to show you how to develop a strategy that you can have real confidence in. (Not a member yet? Get started for $1 today)
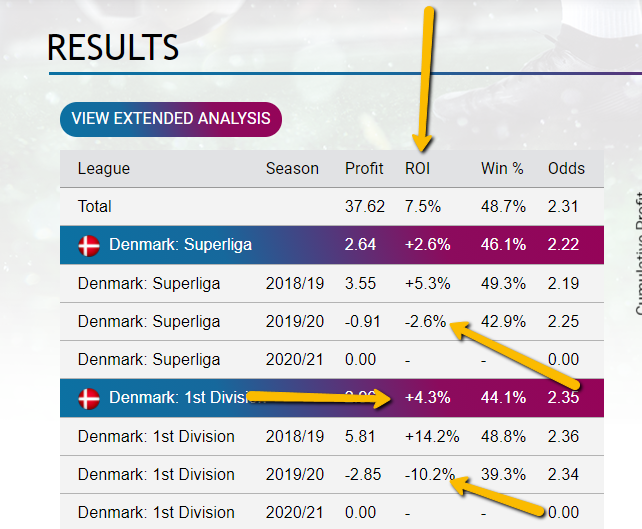
I found this while trying to create a medium strike-rate system. The Danish Superliga’s ROI is 7.5% across the last two seasons, and it is 4.3% for the second tier. Not incredible by any means, but reasonable.
However, in both leagues, the system lost money in 2019/20. Do you think it is a good idea to proceed with this system, hoping it goes back to making money?
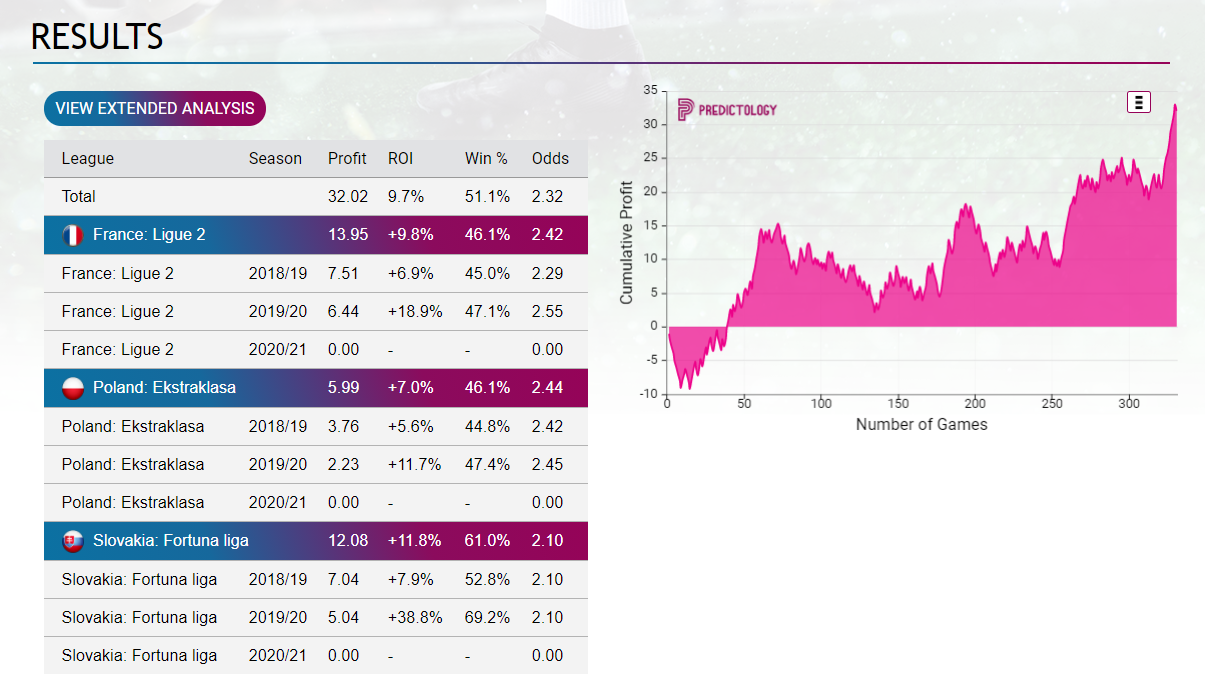
Eventually, I came across this system, which was far better with profit in two successive seasons with all three leagues. It is the strategy outlined in the medium strike-rate article.
One possible concern is that the profit jumped in 2019/20, and Predictology hasn’t provided the data for 2020/21 yet. However, it is a system with potential, though it would be wise to monitor it further to see whether it continues to perform to a reasonable level.
Ultimately, the system you analyse must show CONSISTENCY of profit. Otherwise, it is a waste of time and money.
The charts in Predictology are a fantastic way to see how a system performs over time. You can see that this one has the peaks and troughs expected from something that only wins slightly more often than not.


Digging Deeper & Deeper
Even the above only represents cursory analysis. The A/E value and Archie Score are, in my opinion, crucial metrics. Any system that offers a positive actual/expected value figure offers a realistic shot of long-term profitability.
Meanwhile, the Archie Score can tell you if your results are down to chance or skill. You can read about both in greater detail in our blog.
The Extended Analysis tab reveals all the information you need to calculate the requisite data. This particular system has 331 bets in the two seasons for which we have information. This represents a decent sample size. The more wagers, the better, as you get a more accurate picture. Once a strategy is profitable beyond 1,000 bets, chances are, it is a keeper.
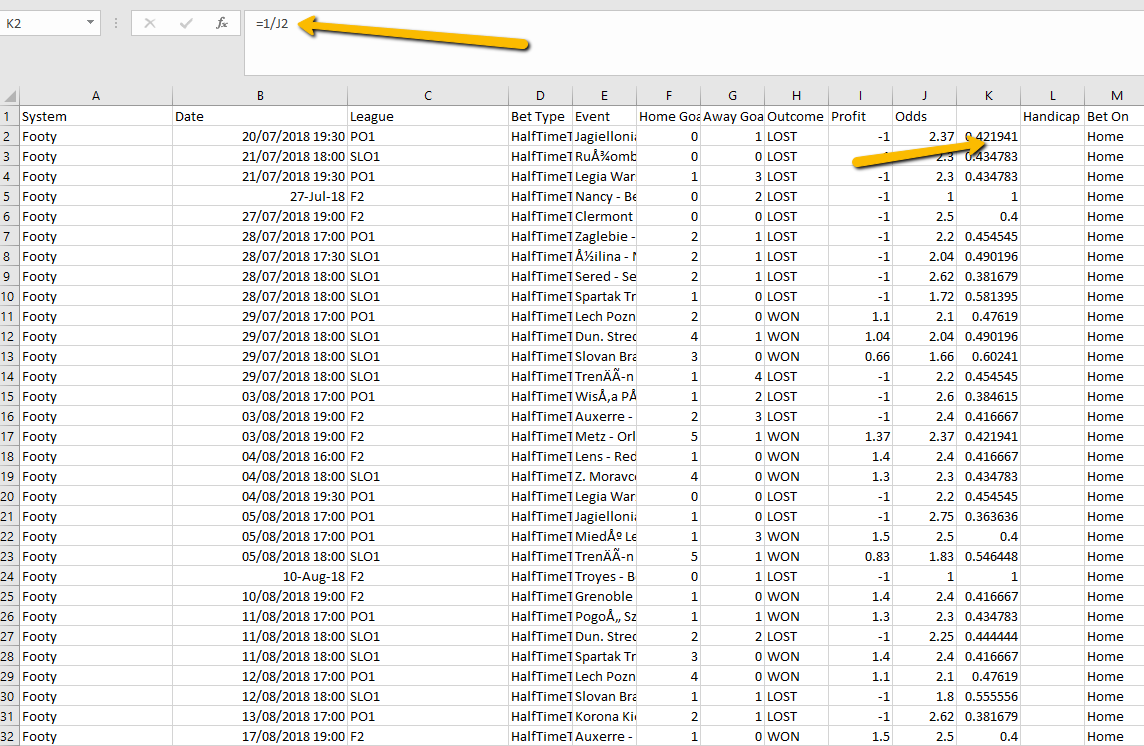
When you download the results in the Excel sheet, you can begin calculating A/E. Above, I typed in =1/J2 to get the probability of each bet winning (the figures are in column J). We need this information to provide our Expected Winners figure.
Adding the probabilities revealed that the expected winner figure is 149.74. We will round it to 150. The system has won 160 bets so far. Therefore, the A/E figure is 1.067. It represents an edge of approximately 6.7%.
So far, so good, but what is this system’s Archie Score? Here is the formula again:
Bets x (Winners – Expected Winners)2
_________________________________________________________
Expected Winners x (Bets – Expected Winners)
Now that we have the A/E, we can calculate this score too.
331 x (160 – 150)2
_________________________________________________________
150 x (331 – 150)
In this case, the Archie Score is 1.22. This suggests an almost 30% chance that this system’s performance is down to luck. It means you should be wary and monitor the system.
The low Archie Score is primarily down to the number of bets. The Archie Score would be close to 4.00 if this system had 1,000 bets and a similar A/E figure. This would represent a 5% chance that the strategy’s profitability was based on luck.
Doing A/E and Archie Score calculations take time but could save you a fortune in the long-term. The Archie Score will almost always be low and suggest results are based on chance if the system has relatively few bets.
Bankrolling & Downturns
One final consideration is the length of the longest losing streak. This system has lost eight bets in a row. However, the lengthiest losing streak will increase the more bets you make. Conventional wisdom suggests a bankroll of 5-10 times your maximum losing streak. It is wise to err on the side of caution with a lower win rate and stay closer to 10 times the bankroll.
Don’t ignore the maximum drawdown! This is the distance between the lowest point in a system’s performance and its previous high point. In this system, the maximum drawdown is just over 13 units. This happened between bet #72 when it was 15.36 units in profit and bet #135 when it was just over two units in profit.
There has been a drawdown of 11 units since, but the system keeps rebounding, and the profit is gradually inching up. Knowing the maximum drawdown is also essential when developing a bankroll.
Generally, at Predictology, we advocate to members to look at a 1x to 2x increase on the largest drawdown when determining the betting bank. Whether it is 1x, 1.5x, or 2X will come down to the risk profile of the strategy
Final Thoughts on Proofing a System
Remember, the bare profit figures are nowhere near enough to determine if a betting strategy is worth your time. All they do is ensure you take a closer look. Your first step is to ensure the profit is consistent and not based on a handful of big wins or a single hot streak.
Then you need to find the A/E and ensure it is well over 1.00. Next, check out the Archie Score; the higher it is, the better, as it is a sign your system is based on skill rather than luck. Finally, take into account the worst losing streaks and maximum drawdown.
You can do all of the above for systems you create and for anything offered by a tipster. If you are paying money for the privilege of using it AND risking money, it is the very least you can do. Don’t be fooled by false promises of enormous profitability; INVESTIGATE the system, and make a decision based on what you find.
Looking For More?
Why not check out some of our most popular posts, including:
> How to profit on the Under 2.5 goals market
> Using Artificial Intelligence To Find Winning Bets
> Advanced Lay The Draw Strategies
We’ve got you covered – Predictology: The Ultimate Football Betting Toolkit
Get Started Today


